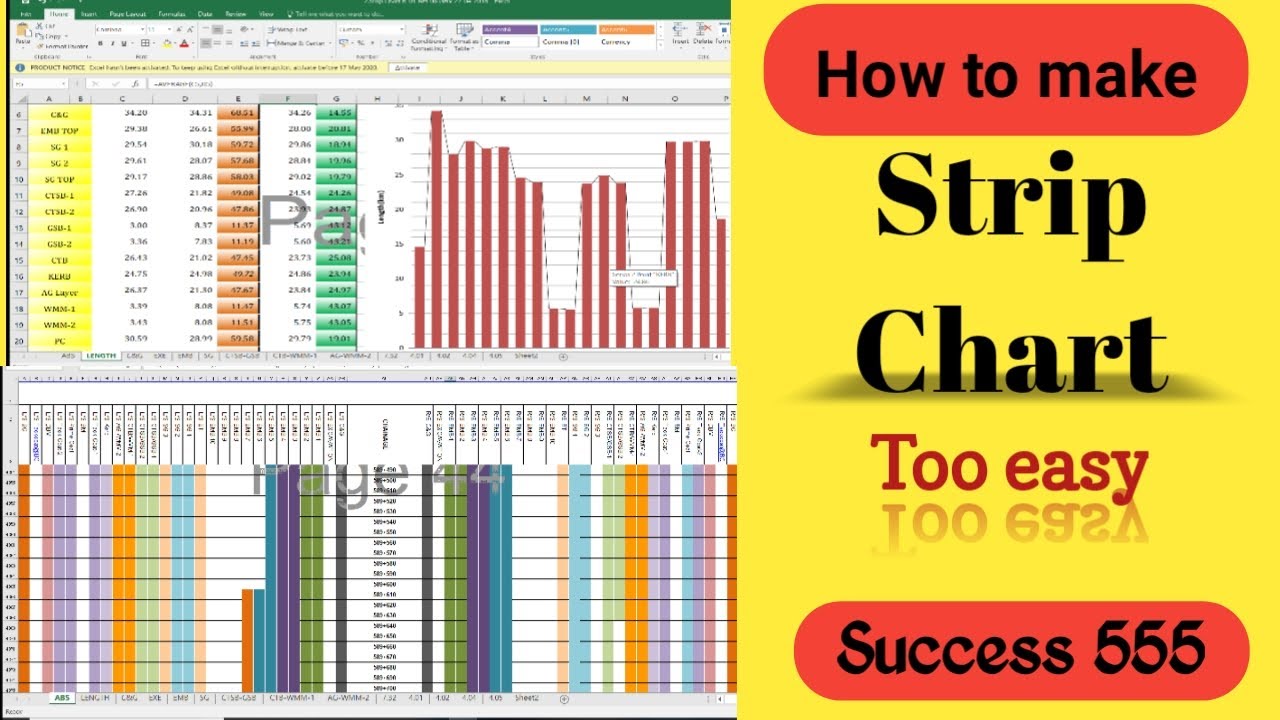
Introduction:
Strip charts change the way industries monitor and visualise real-time data. These tools show dynamic changes with unparalleled clarity. By giving continuous updates, strip charts enable professionals to make quick decisions in fast paced environments.From paper based systems to digital platforms, strip charts have evolved to meet modern needs. They are in healthcare, environmental monitoring and scientific research, to track critical variables with precision and accuracy.
What is a Strip Chart?
A strip chart is a continuous graph of data points plotted against time. Often displayed on a scrolling or stationary format, it captures real-time changes in variables, instantly.
Unlike static graphs, strip charts live for their dynamic nature, updating as new data comes in.
History of Strip Charts
Before the digital age, strip charts were mechanical, using pens and paper rolls to track changes. These devices were called strip chart recorders and were used in many industries to monitor processes.
Modern strip charts have moved to digital, using software and electronics for better accuracy and flexibility.
Parts of a Strip Chart
- Time Axis: Always horizontal, time.
- Value Axis: The variable being measured, e.g. temperature or voltage.
- Graph Line: The main element that shows real-time changes in data.
How Strip Charts Work
A strip chart collects data at intervals and shows it sequentially. As new data comes in, older data moves along the time axis, creating a scrolling effect.
Sensors or devices connected to the chart feed continuous data streams, so you’re always monitoring live.
Types of Strip Charts
Paper-Based Strip Charts
- Classic
- Uses ink pens to record data on paper rolls
- Suitable for low-tech environments
Digital Strip Charts
- More precise
- Connects to computers and software for data analysis
- Customizable
Hybrid Strip Charts
- Paper and digital in one
- For industries moving to modern systems
Strip Chart Applications
Healthcare
- ICU heart rates
- Real-time respiratory functions
Industrial Processes
- Machine performance
- Temperature changes in production lines
Environmental Studies
- Air quality indices
- Weather conditions
Scientific Research
- Data capture
- Real-time chemical reactions
Strip Chart Benefits
- Real-Time: Updates in real-time.
- Easy to Use: For all users.
- Cost-Effective: No need for expensive monitors.
- Customizable: For different data sources and formats.
Strip Chart Drawbacks
- One variable per chart, limits multi parameter analysis.
- Paper versions wear out.
- Digital versions need stable power and software.
Strip Chart vs Other Graphs
Strip Chart vs Line Chart
Both show trends over time but strip charts are dynamic and scroll, line charts are static.
Strip Chart vs Histogram
Strip charts track individual data points over time, histograms group data into intervals for a snapshot of distribution.
How to Create a Strip Chart
- Data Source
What do you want to measure? - Format
Paper or digital? - Calibrate Sensors
Verify data coming in. - Set Chart Options
Axis scales, time intervals, thresholds. - Start Monitoring
Record and interpret in real-time.
Digital Strip Chart Tools
LabVIEW
- Graphical programming
- Highly customizable
MATLAB
- Integrates with scientific experiments
- Analysis tools
Excel Add-ons
- Basic strip chart functionality
- Budget friendly
Case Study: StripCharts in Modern Medicine
In a cardiac care unit, strip charts monitor patients’ heart rates 24/7. Alerts fire instantly if irregularities show up so doctors can respond quickly.
This has saved lives by giving healthcare professionals real-time data.
StripChart Trends
AI Strip Charts
AI algorithms predict trends and anomalies.
Cloud Monitoring
Data anywhere, anytime.
Visualizations
Dynamic colors and patterns.
Conclusion
Stripcharts are essential tools for dynamic data visualization and real-time monitoring. From mechanical to digital they have come a long way. Whether you want to increase productivity, ensure safety or simplify complex data the strip chart is the versatile and reliable choice.
By integrating modern advancements such as AI and cloud technology, strip charts are set to remain at the forefront of data monitoring for years to come.
Also Read: Afilmywap and Piracy: How It Affects the Film Industry
FAQs
Which industries benefit from stripcharts?
Healthcare, environmental monitoring and manufacturing benefit most from strip charts because they need to track data continuously.
Can strip charts handle multiple variables?
Stripcharts usually focus on one variable. But advanced systems can do multiple charts at once for more insight.
Are digital strip charts expensive?
Digital options vary in cost but can be cost effective in the long run by reducing manual monitoring costs.
How do I get accuracy with stripcharts?
Calibrate sensors and keep software up to date to get accurate data.
Are paper strip charts still relevant?
Yes in low resource environments or when simplicity and reliability is key.
What are the challenges with stripcharts?
Dependence on stable power for digital versions and single variable limitation are common challenges.

